
Population projections and economic analysis
Cohort-component and trend projections, households and housing need, dependency ratios, location quotients, shift-share, and measures of inequality.
Lesson 3 of 40 · about 27 minutes · Outline areas: 1.1 Conducting research and acquiring knowledge; 1.2 Data and source interpretation and evaluation
Learning objectives
- Describe the cohort-component method and explain when simpler projection methods are good enough.
- Calculate a linear and a geometric projection, a housing-unit population estimate, and a dependency ratio.
- Convert a population projection into households and the housing units needed to serve them.
- Calculate and interpret a location quotient.
- Explain the three components of shift-share analysis and compute the industry-mix effect.
- Interpret the index of dissimilarity and the Gini coefficient.
Key concepts
Projections, forecasts, and estimates
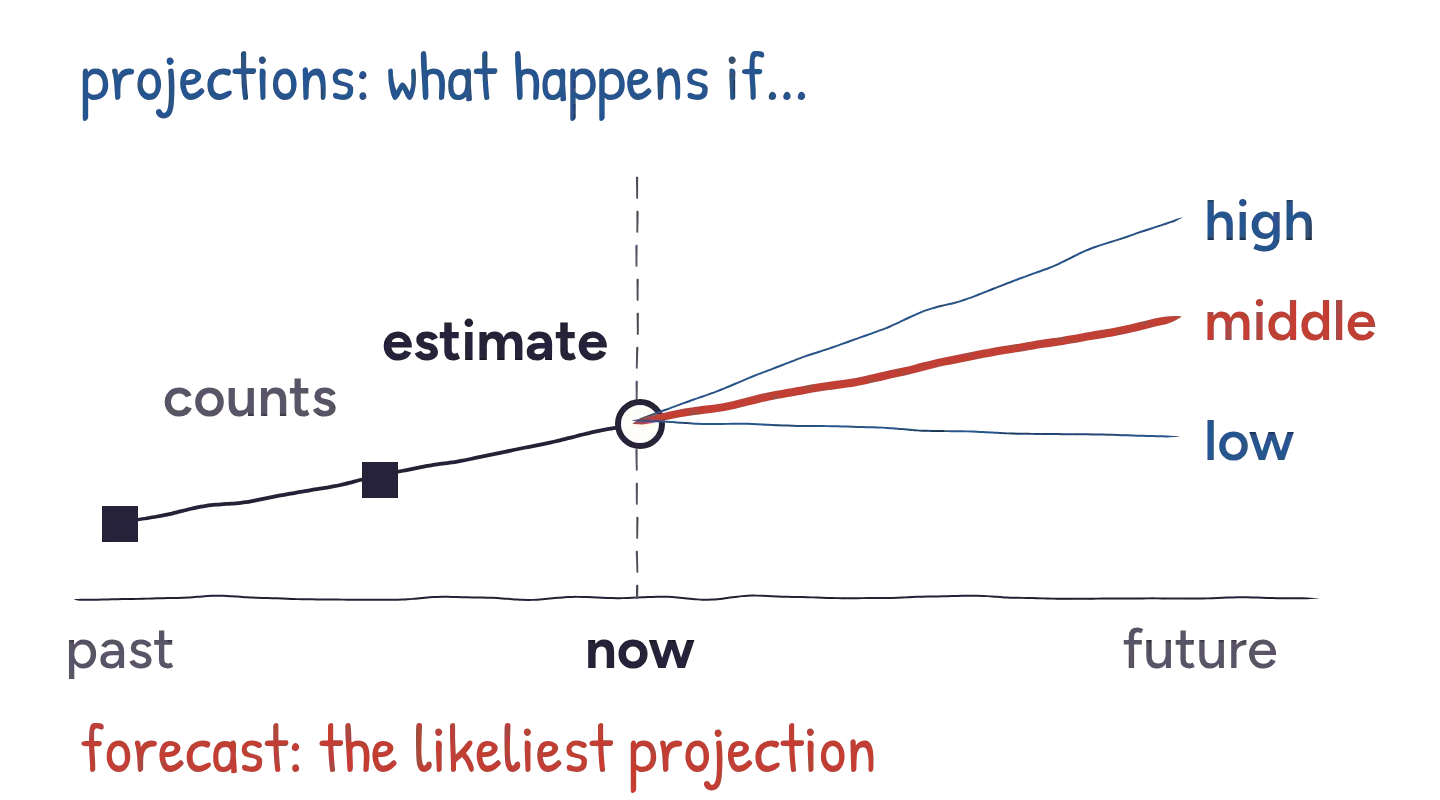
These words are often used loosely, but they mean different things:
- An estimate describes a current or past value that wasn't directly counted (this year's population, between censuses).
- A projection shows what would happen if stated assumptions hold. It's conditional: "if current trends continue…"
- A forecast is the projection the analyst judges most likely.
Every projection rests on assumptions, so good practice is to state them plainly and often to show low, middle, and high scenarios.
8 more sections follow in the full lesson.
Key terms
- Projection: A conditional statement of what would happen if stated assumptions hold.
- Cohort-component method: A projection method that ages population cohorts forward using fertility, mortality, and migration.
- Net migration: In-migrants minus out-migrants over a period.
- Linear projection: Extrapolation that adds a constant amount each period.
- Geometric projection: Extrapolation that applies a constant growth rate each period.
- Housing-unit method: Estimating population from housing units, occupancy, and household size.
- Dependency ratio: Dependents (children and older adults) per 100 working-age people.
- Location quotient: The ratio of an industry's local employment share to its national share.
- Basic (export) industry: An industry that sells mainly to customers outside the local economy.
- Shift-share analysis: A breakdown of local employment change into national, industry-mix, and local components.
- Index of dissimilarity: A 0–100 measure of how unevenly two groups are distributed across subareas.
- Gini coefficient: A 0–1 measure of inequality in a distribution.
- Natural increase: Births minus deaths.
- Net migration: People moving in minus people moving out.
- Headship rate: The share of people in an age group who head a household, used to project households.
- Vacancy allowance: A margin of vacant units added to projected households so a housing market can function.
- Lorenz curve: A graph of the cumulative share of income held by households ranked from poorest to richest; the farther it sags below the diagonal, the greater the inequality.
Create an account to see the rest of this lesson
Every lesson and full-length practice exam is open to you. An account keeps your scores and progress in one place so you can see where to study next.
Just looking? The list of lessons and the sample questions are open to everyone.
Ready for exam-style questions?
The checkpoints in this lesson were written for it alone, so they never give away an exam question. To see how the Research domain is tested, take a full-length practice exam. It mixes all nine domains in exam proportions, and your results point you back to the lessons behind every question you miss.
Exams need an account, so your scores are saved. Create one to get started.